FOLLOW US

Thursday, October 3, 2013

One click access to CLARIFIED for Clarizen reports from Clarizen


Currently we're working on new functionality which makes it possible to open CLARIFIED for Clarizen reports from within Clarizen or Salesforce.

From the custom actions menu in Clarizen it will be possible to open a popup window with the report of your needs based on CLARIFIED for Clarizen's dataset which holds your project data. Out-of-the box it will be possible to open project status, billing or resource utilization reports. Over time we will extend this set with new reports or custom built reports only accessible for your organization.

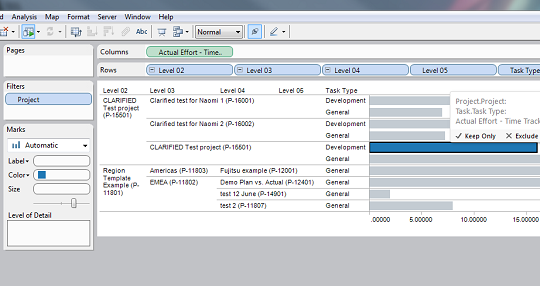
Open reports from within Clarizen or Salesforce 

See Project details within seconds

Interested in this and much more CLARIFIED for Clarizen has to offer?
  • v6 compatible
  • Clarizen Partner: supports every Clarizen edition (profesional, enterprise, unlimited)
  • CLARIFIED for Clarizen can connect to numerous BI tools like Tableau, DundasCubeware and TARGIT.
  • Within a few clicks access to all your Clarizen Project data.
  • Out-of-the-box slice and dice functionality.
  • No more time needed to develop Excel queries or lookup’s.
  • Out-of-the-box reporting for billing purposes is easy. Fields include Billing Type, Fixed Price and Period selection. So reporting all Revenue that should be billed in a given period is easy and saves a lot of time and errors for the accounting department.
  • Resource Utilization can be represented graphically, both on individual and on Group level. Resource Utilization can be shown on Planned and Actual effort.

Watch the product video here or sign up now for the 30-day trail. Click here to try it free for 30 days!

Friday, June 21, 2013

MOVIE: Use QlikView to analyze your Clarizen project data


With CLARIFIED for Clarizen it's possible to analyse, create dashboards or reports with Qlikview on your Clarizen project data. In the video below you can see how it's done.

Main features and benefits of QlikView:
  • use of an in-memory data model
  • automated data integration and a graphical analytical environment attractive for customers
  • fast and powerful visualization capabilities
  • flexible - allows unlimited dimensions and measures and can be modified in seconds
  • integrated - all in one solution : dashboards, power analysis and simply reporting on a single architecture
  • risk free - available as a fully-functional free trial download


Next to Qlikview it's possible to use numerous other BI tools which can connect to a Microsoft Analysis Services cube.

Interested?
You can use CLARIFIED for Clarizen free for 30 days to make sure you like it. We don't ask you for a credit card when you sign up, so if you don't like it, there's nothing to cancel. And because CLARIFIED is Cloud Based, there is nothing to install! Click here to try it free for 30 days.

Friday, June 14, 2013

MOVIE: Connect to CLARIFIED for Clarizen within seconds using Tableau


As a follow up on the previous post we want to show you how easy it is to connect Tableau 8.0 to CLARIFIED for Clarizen.

Within a minute you're connected and can start using Tableau's powerful visualization and analytical capabilities. No need to develop expensive and timeconsuming Excel file sources. All your Clarizen project data already resides in your CLARIFIED for Clarizen environment ready for you to use.


Next to Tableau you can use numerous other BI tools which can connect to CLARIFIED for Clarizen.

Interested?
You can use CLARIFIED for Clarizen free for 30 days to make sure you like it. We don't ask you for a credit card when you sign up, so if you don't like it, there's nothing to cancel. And because CLARIFIED is Cloud Based, there is nothing to install! Click here to try it free for 30 days.

You can also use Tableau 14 days for free, download your trial here.

Next week:
Keep an eye on this blog next week when we will show you how easy it is to create your own dashboards based on your Clarizen project data with Tableau and CLARIFIED for Clarizen.

Tuesday, June 4, 2013

Clarizen project data in Tableau


As we get more and more questions about if it is possible to use CLARIFIED for Clarizen data in Tableau, I will show you some examples below.


With Tableau it is very easy to create dashboards and analytics on CLARIFIED for Clarizen data. A connection to the CLARIFIED Cube can be made in minutes with the Microsoft Analysis Services connection in Tableau. In addition, Tableau has also a server version in which you can share your worksheets with other users. Read more about Tableau here: www.tableausoftware.com or view the Tableau product demo here : https://www.youtube.com/watch?v=37Mx3uZRwBE

Below are some examples that we have created with Tableau and the Clarizen Demo environment:
- Profitability By Account
- Profitability by Project Type
- Profitabilty by Project Manager
- Active Projects per Project Manager
- Resource Utilization


Profitability by Account


Click here to view the original screenshot.


Profitability by Project Type


Click here to view the original screenshot.


Profitability by Project Manager


Click here to view the original screenshot.


Active Projects per Project Manager

Click here to view the original screenshot.


Resource Utilization

Click here to view the original screenshot.


Resource Utilization

Click here to view the original screenshot.


30-Day free Trial
You can use CLARIFIED for Clarizen free for 30 days to make sure you like it. We don't ask you for a credit card when you sign up, so if you don't like it, there's nothing to cancel. And because CLARIFIED is Cloud Based, there is nothing to install! Click here to try it free for 30 days.

More information
Visit our website at www.clarified.biz for more information about CLARIFIED for Clarizen.


Tuesday, May 21, 2013

CLARIFIED for Clarizen: report section added to the portal.


Together with the release of CLARIFIED for Clarizen v1.3.3 we've also added a new section to the CLARIFIED for Clarizen portal: the report section.

In this new section it's possible to download template reports which can serve as a starting point for your custom reports. We're starting off with Microsoft Excel templates and will expand the section with templates for other BI tools like Tableau in the coming months.


Microsoft Excel templates in the following categories are now available for you to download: summaries, project, financials and resources. In the weeks to come we will extend the Microsoft Excel templates portfolio with new templates and new categories.


Templates that are available right now are:
      • Customer summary
      • Projects overview on state
      • Projects earned value chart
      • Billing
      • Resource Utilization
Watch this video to see where you can find the report section and how to download and refresh the Microsoft Excel template you downloaded!

Sign-up now!
You can use Clarified for Clarizen free for 30 days to make sure you like it. We don't ask you for a credit card when you sign up, so if you don't like it, there's nothing to cancel. And because Clarified is Cloud Based, there is nothing to install! Click here to try it free for 30 days.

More information
Visit our website at www.clarified.biz for more information about CLARIFIED for Clarizen.

Friday, May 17, 2013

CLARIFIED for Clarizen version 1.3.3 released


We are proud to announce that we've released CLARIFIED for Clarizen version 1.3.3 with improved backend processing and increased overall performance! Watch the product video here.

Reporting for billing purposes is now even easier with the added fields:
  • Billing Type (Actual Cost, Fixed Price, Not Billable)
  • Has Fixed Price, Has Fixed Cost
  • Cost Type (Actual Cost, Fixed Cost)


We've also added new count measures:
  •  New count measures (Work Item Count, Project Count)


Added value
CLARIFIED for Clarizen’s added value consists of:
  • Within a few clicks access to all your Clarizen Project data.
  • Out-of-the-box slice and dice functionality.
  • No more time needed to develop Excel queries or lookup’s.
  • Out-of-the-box dash boarding on an Executive level is. One can even set Revenue or Profit Goals on any given context (like a given Portfolio and Year period) and compare the Actuals against it graphically.
  • Out-of-the-box reporting for billing purposes is easy. Fields include Billing Type, Fixed Price and Period selection. So reporting all Revenue that should be billed in a given period is easy and saves a lot of time and errors for the accounting department.
  • Resource Utilization can be represented graphically, both on individual and on Group level. Resource Utilization can be shown on Planned and Actual effort.
  • Tracing inconsistent data entry in Clarizen is made easy. Like reporting all Time sheet effort that is not approved yet.
  • CLARIFIED for Clarizen can connect to numerous BI tools like Tableau, Dundas, Cubeware and TARGIT.

30-Day free Trial
You can use Clarified for Clarizen free for 30 days to make sure you like it. We don't ask you for a credit card when you sign up, so if you don't like it, there's nothing to cancel. And because Clarified is Cloud Based, there is nothing to install! Click here to try it free for 30 days.

More information
Visit our website at www.clarified.biz for more information about CLARIFIED for Clarizen.

Thursday, March 21, 2013

OLAP PivotTable Extension

Recently I was working on a PivotTable Report with data from a SSAS Cube (Excel version 2010).
I needed a Profitability Trend calculation for a client, but this calculation was not available in the Cube. Because in Excel 2010 the functionality to create calculated measures is not exposed in the User Interface, I searched on the internet and found OLAP PivotTable Extension, a free add-in for Excel.


Click here to check out the features of OLAP PivotTable Extension.

Thursday, February 21, 2013

CLARIFIED for Clarizen Pricing Plan Update

We have updated our CLARIFIED for Clarizen pricing plan for large volume users of Clarizen (75+) and wanted to share this information with you.

The new CLARIFIED for Clarizen plan will include the following:
• A fixed yearly license fee of USD 6,500, for an unlimited user count.
• Optional one-time setup fee of USD 2,300 for custom fields.
• Optional but recommended: prepaid 10 hours of consultancy for USD 1,200.


Why we changed the pricing plan

CLARIFIED for Clarizen has grown and we have learned a lot over the last year, and our users, partners and others have provided valuable feedback to us along the way. We understood that the license fee was getting too high for large volume users of Clarizen (75+) and for that reason we changed it.


30-Day free Trial
You can use Clarified for Clarizen free for 30 days to make sure you like it. We don't ask you for a credit card when you sign up, so if you don't like it, there's nothing to cancel. And because Clarified is Cloud Based, there is nothing to install! Click here to try it free for 30 days.

Clarizen Apps Store
You can also find us in the Clarizen Apps store here.


Thursday, February 14, 2013

CLARIFIED for Clarizen - Tableau

Probably you already knew that CLARIFIED for Clarizen is the reporting and analysis service for Clarizen users, offers rich dashboards and enables you to analyze your Clarizen data across all projects, using various criteria. All this within just a few mouse clicks.

But did you know it can be used as a source for bringing your reports and dashboards through Tableau?

Tableau
Tableau is a Business Intelligence software that provides browser-based analytics and reporting anyone can learn and use. It’s a rapid-fire alternative to the slow pace and rigidity of traditional Business Intelligence software. Click here for more information about Tableau.

Experience
After downloading Tableau, it just took me 5 minutes to install and connect Tableau to the CLARIFIED for Clarizen cube. Connecting to the cube was very easy with an Analysis Services Connection in Tableau. Within a view clicks I had instant reporting and visualization!


Besides using Tableau other third party Business Intelligence or reporting solutions like DundasTargitQlikView or RoamBI can be used to create your own dashboards.

Interested in CLARIFIED for Clarizen? Please contact us via info@bi-architects.nl or visit our www.clarified.biz portal for more information and to start your trial of today!


Friday, January 18, 2013

List All SSIS Packages Deployed On Your Integration Server


One way of checking wich SSIS packages you've deployed on your integration server and wich version build numbers they have is by running a TSQL query against the MSDB database on the server where your integration services  is running.

I found the following blogpost with a very usefull TSQL script:

http://blog.hoegaerden.be/2010/01/10/list-all-ssis-packages-deployed-on-your-integration-server/

NOTE: the query was written for SQL Server 2008. For SQL Server 2005: sysssispackagefolders => sysdtspackagefolders90 and sysssispackages => sysdtspackages90.